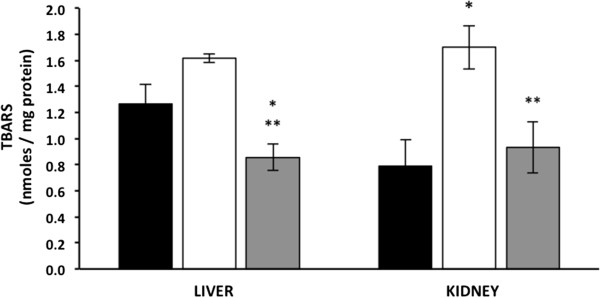
Figure 5.

Effect of hyperglycaemia and curcumin on TBARS levels. Black bars, wild type mice (WTM, n = 4); empty bars, untreated-diabetic mice (UDM, n = 4); gray bars, treated-diabetic mice (TDM, n = 9). Data are given as the means ± standard error of the mean (SEM). *p < 0.05 vs. WTM; **p < 0.05 vs. UDM.
