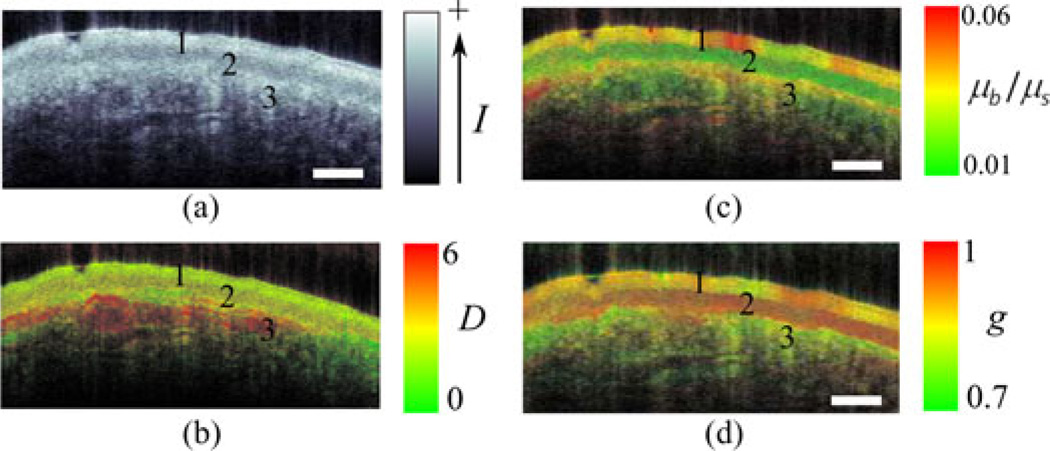
Fig. 6.
An example application of the model: The ISOCT method uses the model to quantify optical and ultrastructural properties in an image map from ex vivo rat buccal sample (adapted with permission from [35]). (a) Conventional OCT images. Three layers were labeled as (1) Keratinized epithelium, (2) stratified squamous epithelium, and (3) submucosa. (b)–(d) Pseudocolor ISOCT images encoded with D, µb/µs, and g. Bar = 200 µm.

