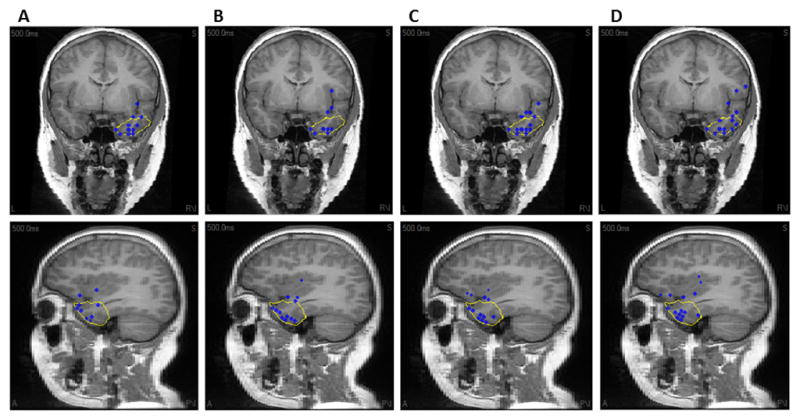
Fig. 2.

The source location of all interictal spikes in Patient 3 obtained using respectively (A) 128, (B) 96, (C) 64 and (D) 32 electrodes. The blue dot represents the location of maximum of sLORETA inverse solution. The yellow line shows the resection boundaries. Note that the spike maxima are projected to the plane of view.
