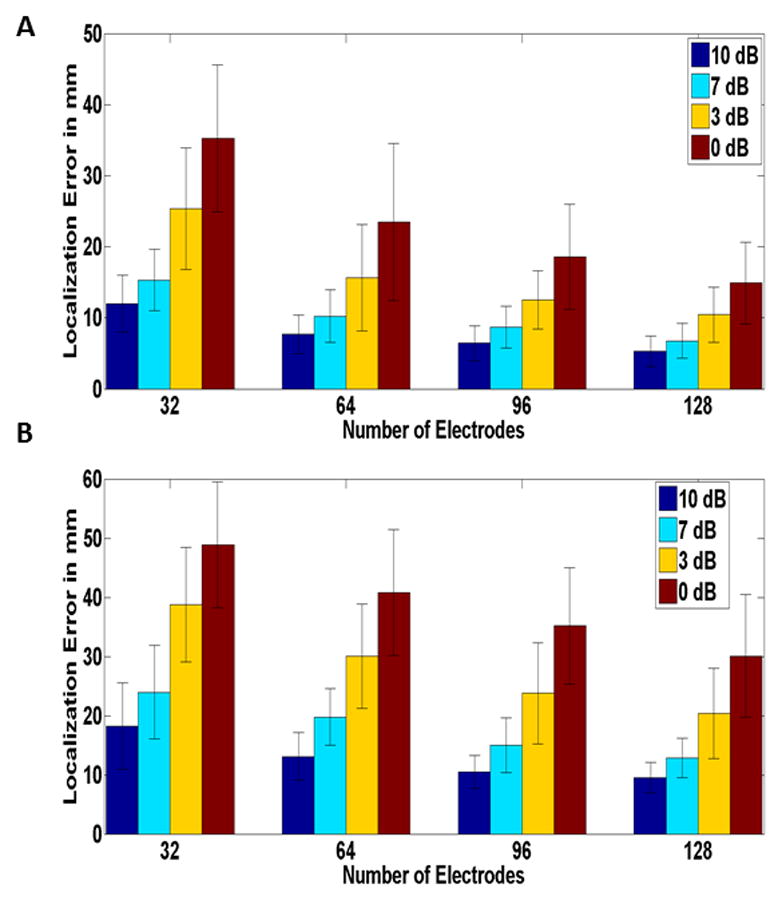
Fig. 7.

Source localization Error for different electrode numbers and various SNRs for (A) superficial and (B) deep dipoles in a realistic BEM model (Simulation Study). Mean values corresponding to source localization error of 100 simulated points of random location and orientation, depicted. The black bars represent the standard deviation. Each color represents different SNR values. Note that the same relation as in (Fig. 5) can be seen regardless of source depth.
