
Figure 2.
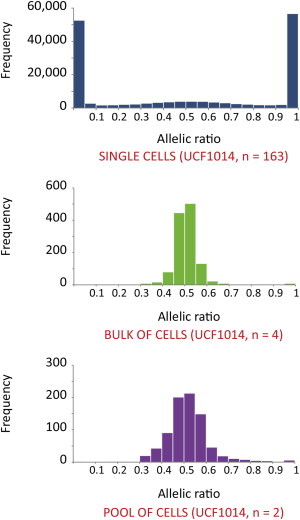
ASE in Single Cells
The histograms show the frequency distribution of the allelic ratio (reference reads per total reads) of 35,763 hetSNVs (≥20 RPSM) in 163 single cells (UCF1014 sample), bulk cell samples, and the pool of single-cell samples.