
Figure 3.
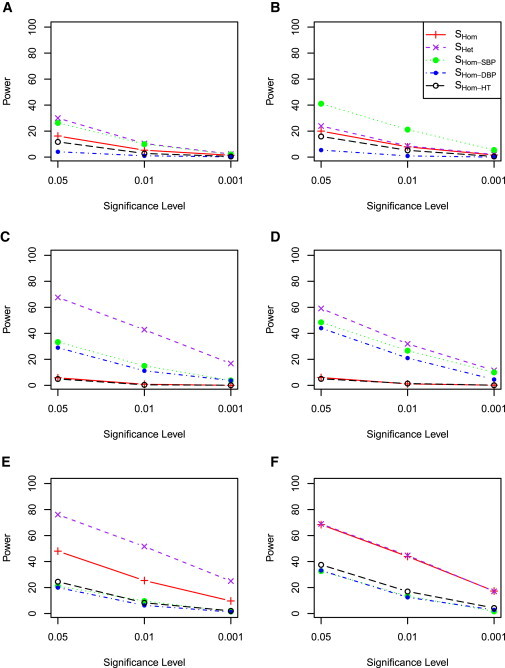
Power Comparison of SHom and SHet when One Cohort Has Genetic Contribution
SBP and DBP were simulated independently. HTN was simulated according to SBP and DBP and simulated medication status. Five cohorts were simulated, but only one of the five cohorts has a genetic contribution. Left: No overlapping samples among the five cohorts. Right: 500 samples were the same in each cohort and a genetic variant contributes phenotypic variation for the same samples.
(A and B) A genetic variant affects only SBP.
(C and D) A genetic variant affects both SBP and DBP but with opposite effect directions.
(E and F) A genetic variant affects both SBP and DBP with the same effect direction.