
Figure 5.
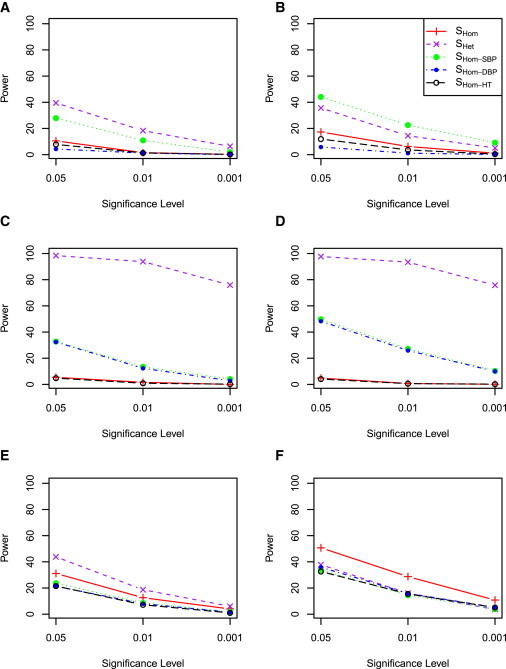
Power Comparison of SHom and SHet with Correlation 0.5 when One Cohort Has Genetic Contribution
SBP and DBP were simulated with correlation 0.5. Five cohorts were simulated but only one of the five cohorts has a genetic contribution. Details as in Figure 3.