
Figure 8.
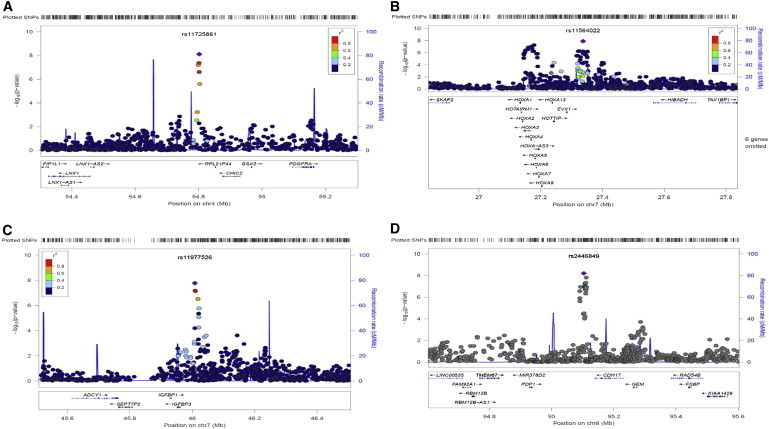
Regional Association Plots
Regional association plots of the four SNPs reaching genome-wide significance (p < 5 × 10⁻⁸) by SHet for the COGENT BP GWAS data. The most significant SNP at each locus is shown in purple. The fine-scale recombination rate is shown as a blue vertical line. Gene positions are shown at the bottom.