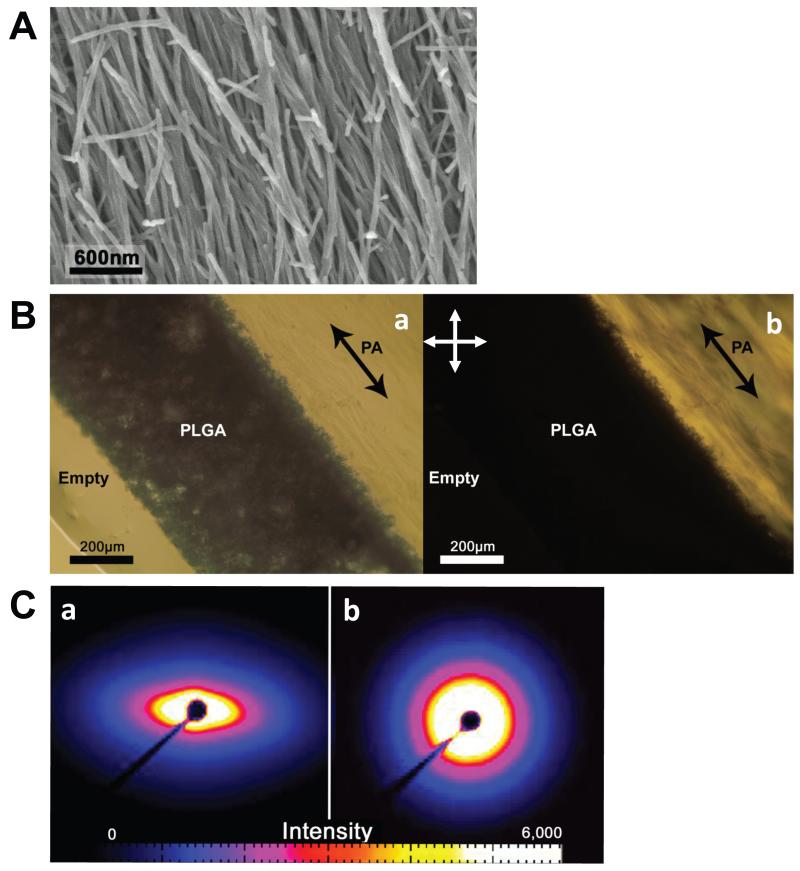
Fig. 3.
(A) SEM showing the aligned PA nanofibers inside the PLGA tube constructs. The tubes were cut in half along their long axis to expose the nanofibers. (B) ~0.5mm longitudinal section of the tube constructs is imaged using optical microscopy. a: Imaged under brightfield mode, the porous scaffold is shown with the inner PA gel on the right. b: Imaged between cross polars with orientation shown in the upper left, domains of nanofibers aligned diagonally appear bright while horizontal and vertical domains appear dark. The dark arrows indicate long axis of tubes. (C) a: The ~0.5mm tube section was probed using small angle X-ray scattering (SAXS). The sample was oriented with the long axis vertical (see supplemental information). The SAXS pattern shows an obvious pinched profile indicating nanofiber alignment along the long axis of the tube. b: An unaligned gel was also probed to show contrast between aligned and non-aligned SAXS data.

