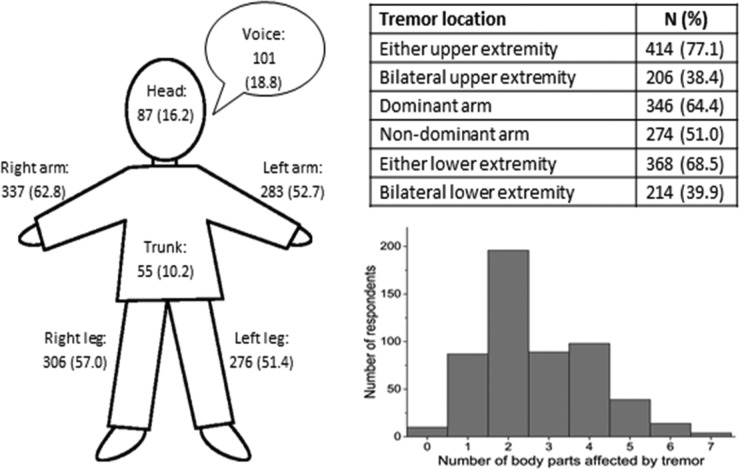
Figure 2.
Bodily distribution of tremor among surveyed registrants. The figure depicts the number (%) of patients reporting tremor in each of 7 bodily regions. The table reports the proportion of respondents indicating tremor in either or both upper or lower extremities, and the occurrence of tremor in the dominant versus non-dominant arm. The histogram depicts how the tremor was distributed throughout the body for respondents with at least mild tremor.

