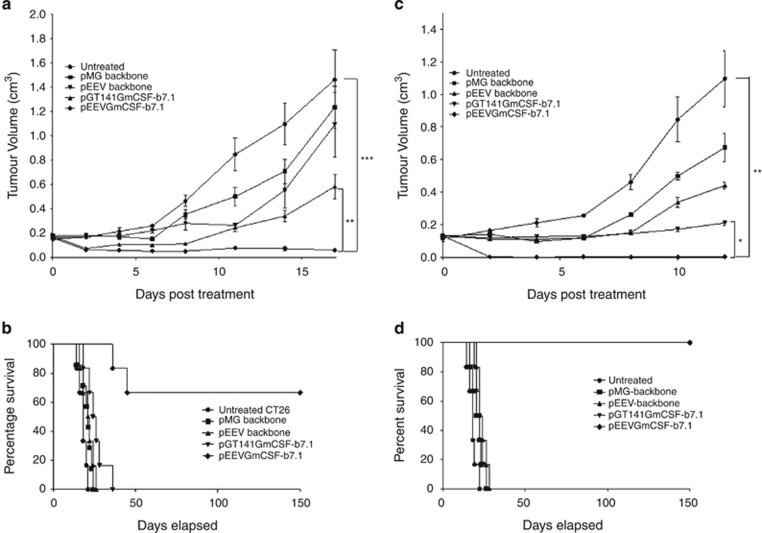
Figure 1.
Therapeutic effect on established CT26 and B16F10 solid tumours. (a) Representative CT26 tumour growth curve: each Balb/C mouse was subcutaneously injected with 5 × 10⁵ CT26 cells in the flank. On day 14 posttumour inoculation, tumours were treated with pMG (■), pGT141GmCSF-b7.1 (▲), pEEV (▼) and pEEVGmCSF-b7.1 (♦) or untreated (●). Six mice per groups were used and the experiment was performed two times. Tumour volume was calculated using the formula: V=ab2π/6. Data are presented as the means±s.e.m. It was observed that the pEEVGmCSF-b7.1 therapy delayed the growth of the tumours most effectively in comparison with the other groups. At 17 days post-treatment, pEEVGmCSF-b7.1 significantly delayed tumour growth compared with untreated tumour (***P<0.0004) standard therapy vector pGT141GmCSF-b7.1 (**P<0.002). (b) Representative Kaplan–Meier survival curve of CT26-treated tumours was measured. Only mice treated with pEEVGmCSF-b7.1 survived. Sixty-six per cent of mice survived up to 150 days. All other groups were killed by day 36. (c) Representative growth curve of B16F10 tumour. Each C57BL/6J was subcutaneously injected with 2 x10⁵ B16F10 cells in the flank of the mice. On day 15 posttumour inoculation, tumours were treated with pMG (■), pGT141GmCSF-b7.1 (▲), pEEV (▼) and pEEVGmCSF-b7.1 (♦) or untreated (●). Six mice per groups were used and the experiment was performed two times. At 12 days post-treatment, pEEVGmCSF-b7.1 significantly delayed tumour growth compared with untreated tumour (**P<0.0001) standard therapy vector pGT141GmCSF-b7.1 (*P<0.0001). (d) Representative Kaplan–Meier survival curve of B16F10 showing pEEVGmCSF-b7.1 had 100% survival up to 150 days post-treatment with all other groups killed by day 28. Similar results were obtained in two independent experiments.

