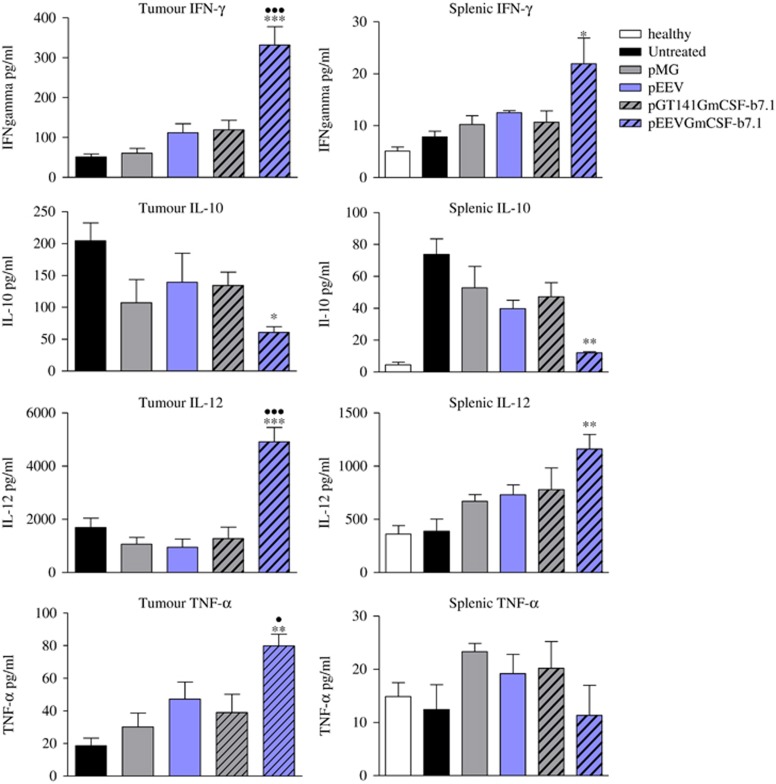
Figure 3.
Cytokine levels (IFN-γ, IL-10, IL-12 and Tumour tumour necrosis factor-α (TNF-α)) as measured from tumour and spleens isolated from B16F10 tumour-challenged treated, untreated and healthy mice. The error bars represent the mean of four individual mice±s.e.m. The significance of differences was determined by one-way analysis of variance (ANOVA) following Bonferroni's multiple comparison (*P<0.05, **P<0.01, ***P<0.001 untreated versus pEEVGmCSF-b7.1 and ●P<0.05, ●●P<0.01, ●●●P<0.001 pGT141GmCSF-b7.1 versus pEEVGmCSF-b7.1. Similar results were obtained in two independent experiments.

