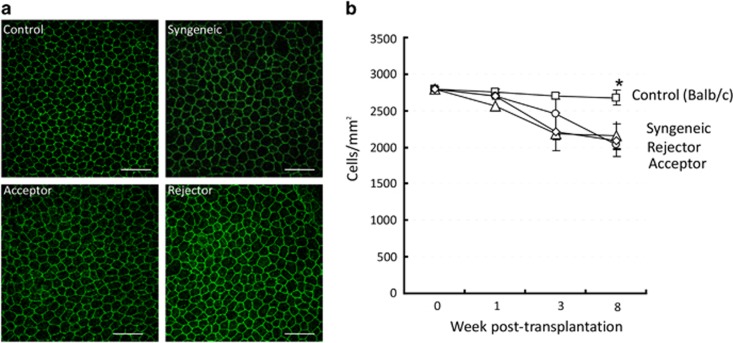
Figure 3.
CEC loss in host beds after transplantation. (a) Representative confocal micrographs of host beds isolated from syngeneically grafted recipients, allograft acceptors, and allograft rejectors at week 3 after transplantation. To visualize endothelial cell-to-cell junctions, corneas were stained with zonula occluden-1 (ZO-1) (green). CEC densities in the normal corneas of age- and sex-matched naive mice are shown as controls. The scale bars are equal to 75 μm (magnification × 40). (b) CEC density in host beds isolated from the different transplant groups and a non-transplant (control) group at day 0, week 1, week 3, and week 8 after transplantation. Each group consists of n=6 mice and data from one out of three independent experiments is shown. A full color version of this figure is available at the Eye journal online.

