Figure 3.

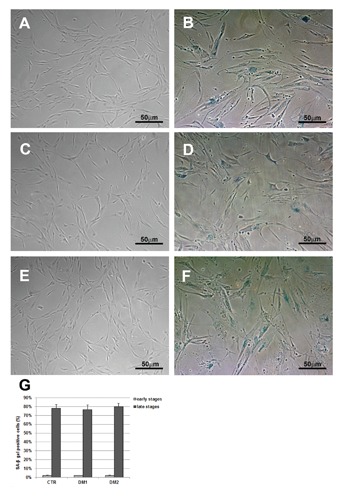
Representative images of CTR (A,B), DM1 (C,D) and DM2 (E,F) myoblasts stained for the senescence-associated β-galactosidase (SA-βGal) activity. At the proliferative (early) stages, very few cells were positive (A,C,E). At the high cell passage (late stages), myoblasts appear large, with the characteristic cytoplasmic blue staining typical of senescence (B,D,F). G) Quantification of the amount of SA-βGal positive cells shows a dramatic increase in the percentage of positive cells at the late stages; scale bars represent SEM.
