
Figure 5.
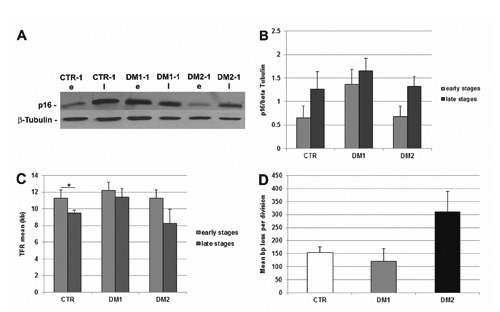
DM premature senescence pathway. A) Representative western blot analyses of p16 in the early (e) and late (l) stages of myoblast proliferative lifespan; the results have been normalized to the expression of β-tubulin. B) Histograms representing mean values of p16 protein expression analysed by densitometry in healthy (CTR; n=4), DM1 (n=3) and DM2 (n=4) patients; at both stages analyzed, p16 was more expressed in DM1 cells as compared to the controls while the expression was similar in DM2 and control myoblasts; scale bars represent SEM. C) Mean length of telomeric restriction fragments (TRF) measured on DM2 (n=4) and control (n=4) myoblasts at proliferative and senescent stage; senescent DM2 cells had shorter telomeres than the proliferating cells (*P<0.05); scale bars represent SEM. D) Mean length (in bps) of telomeric DNA lost per division in control and DM2 myoblasts; DM2 cells lost more bps per division than control cells; scale bars represent SEM.