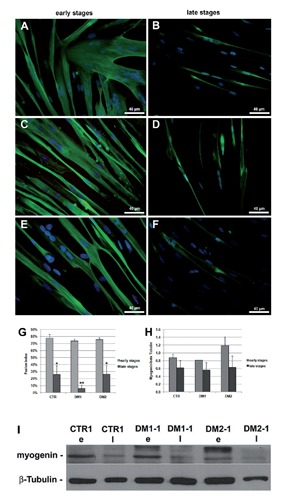
Figure 6.

Differentiation capability of young and senescent myoblasts. A-F) Fast myosin immunofluorescence (green) of control (A,B), DM1 (C,D) and DM2 (E,F) myotubes from myoblasts at early and late stages of their proliferative lifespan, after 5 days of differentiation (T5). Nuclei have been visualized with DAPI (blue). Young myoblasts generate well-differentiated and cross-striated (C,E) myotubes larger than those formed by the senescent cells. G) Fusion index, i.e. the number of nuclei incorporated into myotubes as a percentage of the total number of nuclei, has been calculated in young and senescent myoblasts after 5 days of differentiation; a significant reduction of fusion index is observable in both DM and control myotubes obtained from senescent cells (*P<0.05, **P<0.01). H) Histograms represents mean values of myogenin protein expression analysed by densitometry of control (n=4), DM1 (n=3) and DM2 (n=4) patients; a reduced myogenin expression is observed in myotubes from senescent cells as compared to those obtained from young cells; scale bars represent SEM. I) Representative western blot analyses of myogenin in myotubes obtained from myoblasts at the early (e) and late (l) stages of their proliferative lifespan; the results have been normalized to the expression of β-tubulin.
