
Figure 4.
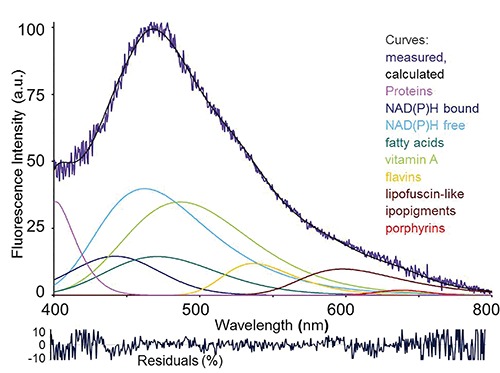
Example of fitting analysis of an autofluorescence spectrum collected via fiber optic probe from a rat liver under living conditions. Real measured spectrum and calculated curve as the sum of the endogenous fluorophore contributions are shown, along with spectral functions representing each endogenous fluorophore. Before analysis, spectra are normalized to 100% at the peak maximum. Curve-fitting procedure is then performed to evaluate the relative contributions of each fluorophore to the overall emission. The procedure consists in an iterative non-linear analysis, based on the Marquardt–Levenberg algorithm through the finding of the true absolute minimum value of the sum of squared deviations of a combination of GMG (half-Gaussian Modified Gaussian) spectral functions, each of them representing the emission profile of a pure fluorophore. The goodness of fitting is verified trough the residual analysis and r2 coefficient of determination, ≥0.898 in this case. Fitting parameters are reported as peak center wavelength (λ) / full width at half intensity maximum (FWHM): NAD(P)H free, 463 nm / 115 nm; NAD(P)H bound, 444 nm / 105 nm; vitamin A, 488 nm /102 nm; fatty acids, 470 nm / 90 nm; flavins, 526 nm / 81 nm. Due to parameter variability because of heterogeneity in composition and fluorescing properties, the functions of lipopigments and proteins are left free to adjust, respectively in the 530-600 nm range, and at λ <440 nm, to reach the goodness of fitting analysis results. Excitation: 366 nm.