
Figure 6.
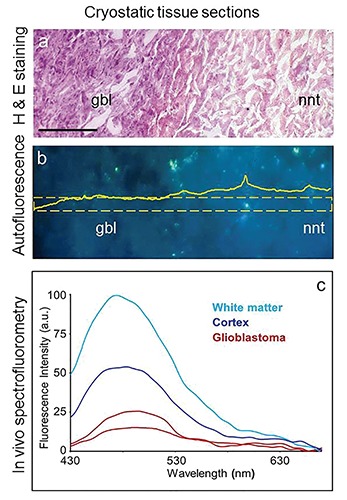
Unfixed cryostatic brain tissue sections from a glioblastoma bearing patient. a) Hematoxylin and Eosin staining evidences an altered stainability and cell density in neoplastic (glioblastoma, gbl) tissue as compared to the surrounding non-neoplastic tissue (nnt). b) Autofluorescence imaging of a serial, unstained tissue section, shows a lower emission signal in neoplastic as compared to the non-neoplastic area; a quantitative representation of this difference is given by the amplitude distribution profile of the selected area indicated by the frame overimposed to the picture. Excitation: 366 nm; emission: 420-640 nm; scale bars: 200 µm. c) Spectrofluorometry performed in vivo, via fiber optic probe during surgical operation showed an even more marked lower autofluorescence amplitude, and spectral profile changes in neoplastic tissue in comparison with the non-neoplastic tissues (white matter and cortex); spectra are shown as real values.