
Figure 9.
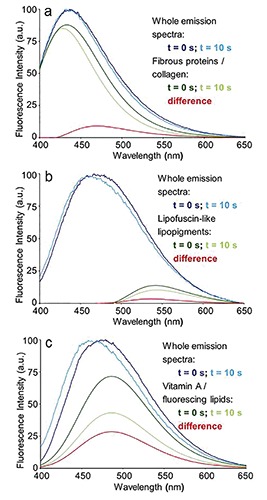
Autofluorescence emission spectra recorded at t = 0 and at t = 10 s of irradiation from unfixed, unstained cryostatic sections of rat livers: connective tissue of a portal area (a) and lipofuscin granules (b) from a normal liver parenchima, and lipid droplet (c) from a fatty liver. The changes induced in the whole emission profile by light irradiation are evidenced by the measured spectra normalized to the peak maximum. The response to irradiation in terms of spectral shape and amplitude changes in the AF emission from collagen, lipofuscin-like lipopigments and vitamin A/fluorescing lipids is represented by the curves of each single fluorophore spectral function. Excitation: 366 nm.