Fig 2.

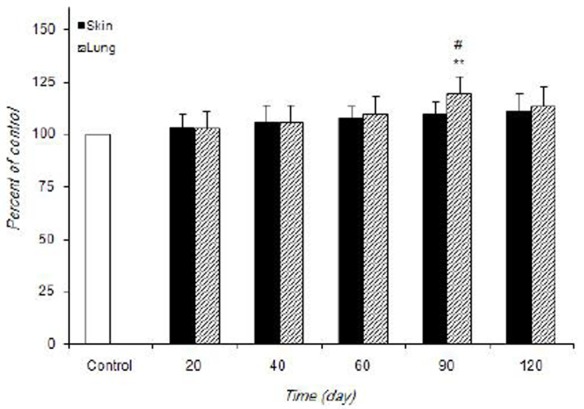
The alteration of CAT activity in control and infected mice at different times during experimentation. Values are expressed as percentage of control (100%)±S.D. (n=7). **P<0.01 vs control. #P<0.05 vs other times in infected mice

The alteration of CAT activity in control and infected mice at different times during experimentation. Values are expressed as percentage of control (100%)±S.D. (n=7). **P<0.01 vs control. #P<0.05 vs other times in infected mice