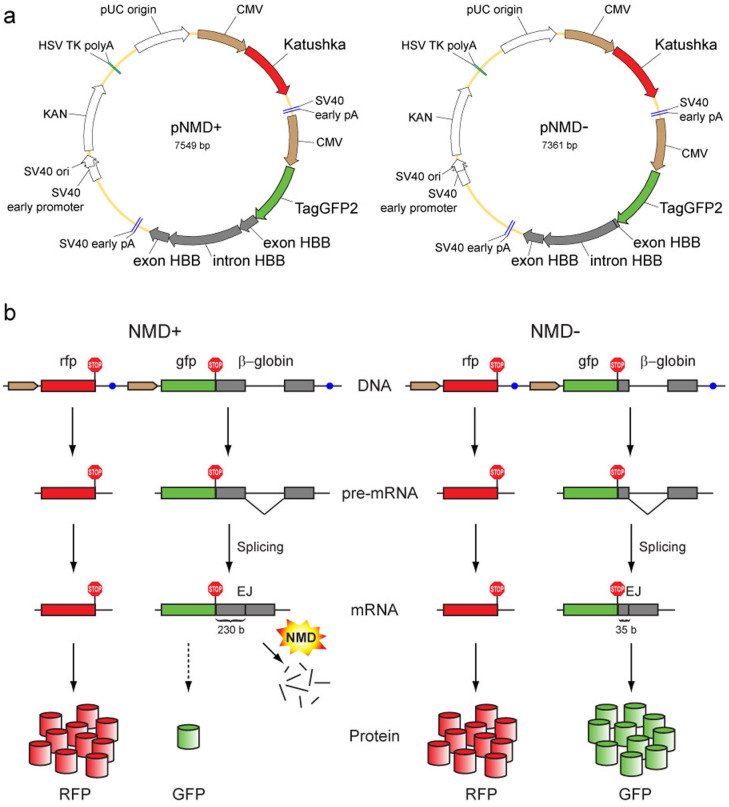
Figure 1. Scheme of the proposed method of NMD analysis.
(a) Main elements in the reporter vectors pNMD+ (left) and pNMD− (right). Brown arrows – CMV promoters. Red arrows – Katushka coding region. Green arrows – TagGFP2 coding region. Grey arrows – human β-globin (HBB) gene fragment. (b) Schematic outline of the reporter function. The pNMD+ vector (left) carries two fluorescent proteins; one (GFP) is encoded by the NMD-targeted transcript, and the other (RFP) serves as an expression efficiency control. The pNMD− control vector (right) encodes both RFP and GFP by NMD-independent transcripts. Comparison of the green-to-red fluorescence ratios between pNMD+ and pNMD− samples allows for the calculation of NMD activity. Brown arrows – promoters. Red, green and grey rectangles – coding regions for RFP, GFP and β-globin, respectively. Blue circles – transcription terminators. Red ″STOP″ signs – stop codons. Red and green cylinders – translated GFP and RFP proteins.

