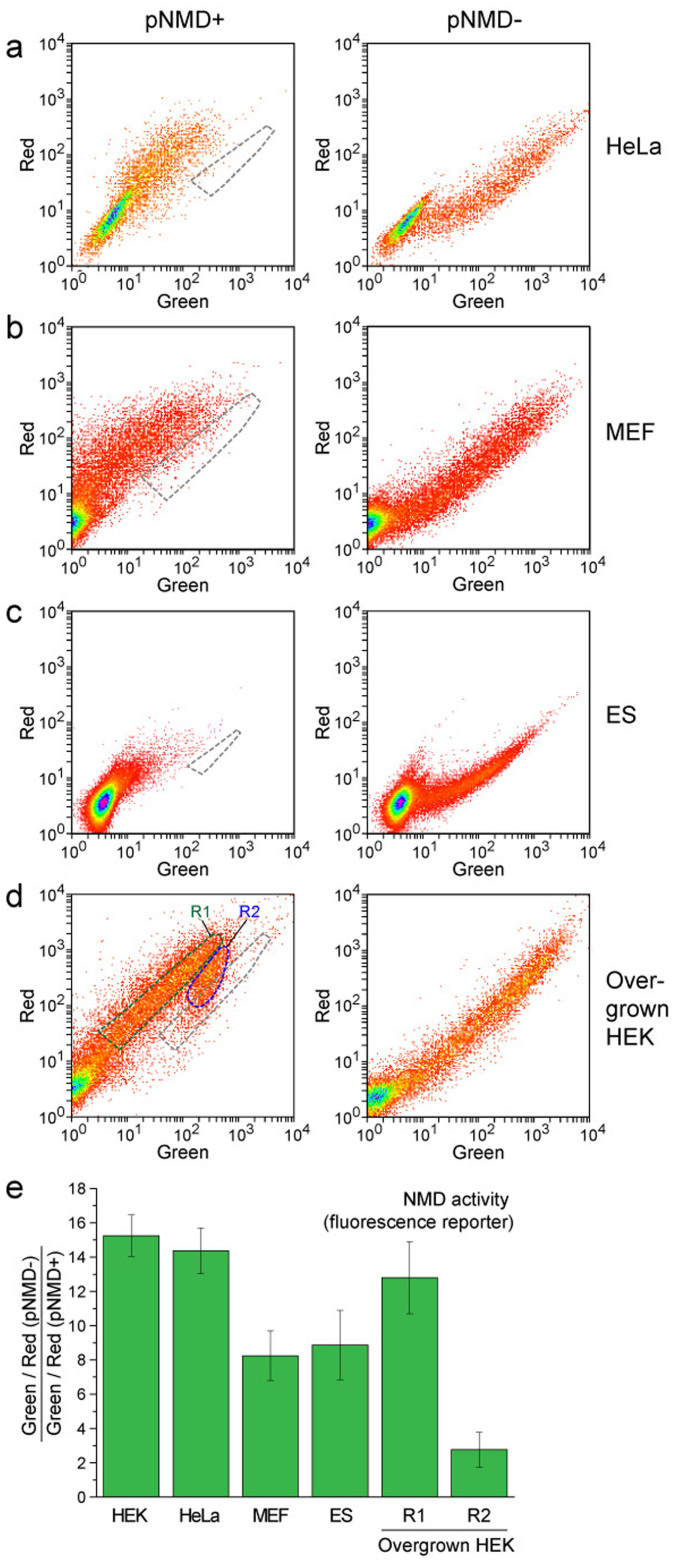
Figure 4. Splicing-dependent NMD reporter in different cell lines.
(a–d) Flow cytometry analysis of the cells transiently transfected with pNMD+ (left plots) or pNMD− (right plots). Corresponding pairs of cell samples were analyzed using the same flow cytometer settings. The area of the corresponding NMD− cells is outlined by a gray dashed line on each NMD+ plot. (a) HeLa cells. (b) MEF cells. (c) ES cells. (d) Overgrown HEK293T cells. Note the clear heterogeneity of the NMD activity in these cells. Green and blue dashed lines show the cell populations R1 and R2 with different NMD activities. (e) NMD activity determined by the fluorescence reporter analysis in the designated cell lines. The mean data and standard deviation of at least 3 independent experiments are shown.

