. 2014 Oct 23;43(46):17463–17474. doi: 10.1039/c4dt00845f

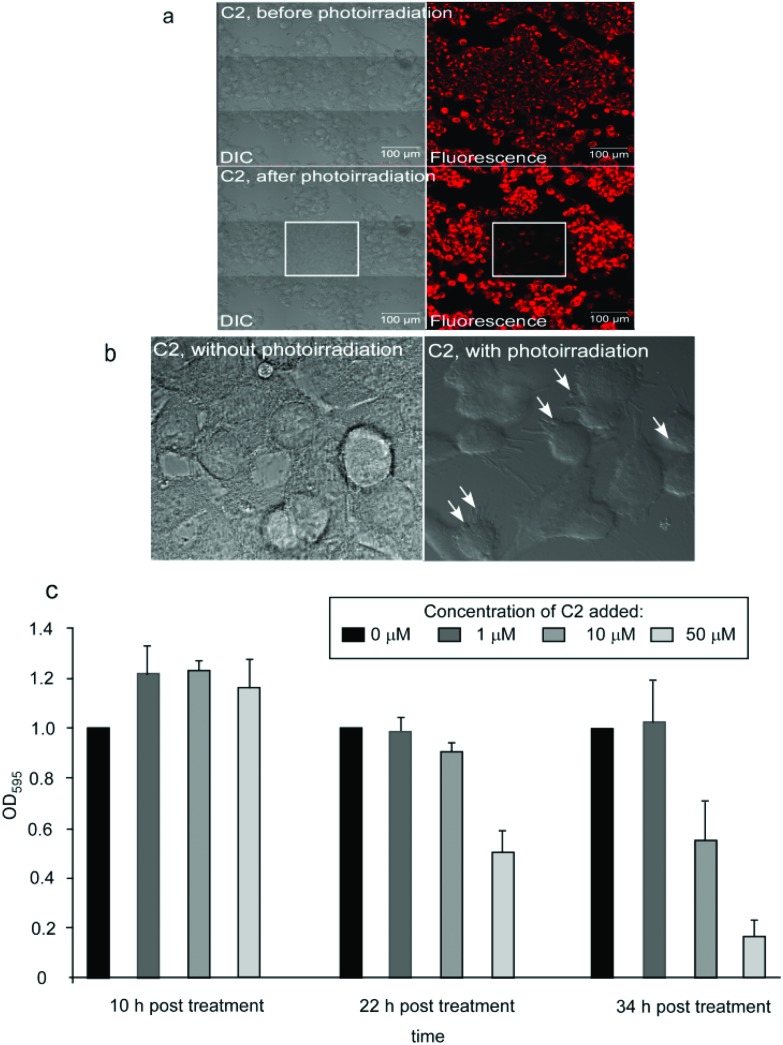
Fig. 6. (a) DIC and confocal fluorescence images of live MCF7 cells treated with C2 and exposed to photoirradiation at 405 nm for 1 hour. The upper panel shows the cells prior to photoirradiation whereas the lower panel shows cells at the end of the photoirradiation period. The central tile represents the field which was exposed to the laser whereas the surrounding tiles represent the fields not exposed. (b) Frames captured from the video of the live imaging of the cells exposed to photoirradiation. Frames for both photoirradiated and non-photoirradiated cells are at 30 minutes of exposure to photoirradiation. (c) MTT assay of MCF7 cells exposed to no or three increasing concentrations of C2 and incubated for 10, 22 and 34 hours.

Fig. 6