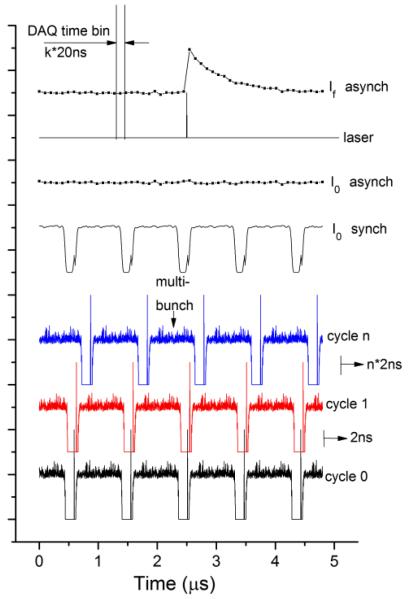
Fig. 2.
Scheme of measurements using synchronous and asynchronous mode of data acquisition system. Distribution of incoming X-ray intensity as a function of time is shown for a few individual cycles and for the averaged intensity in the synchronous and asynchronous mode. Position of the laser pulse and averaged intensity for the fluorescent detector are also shown.

