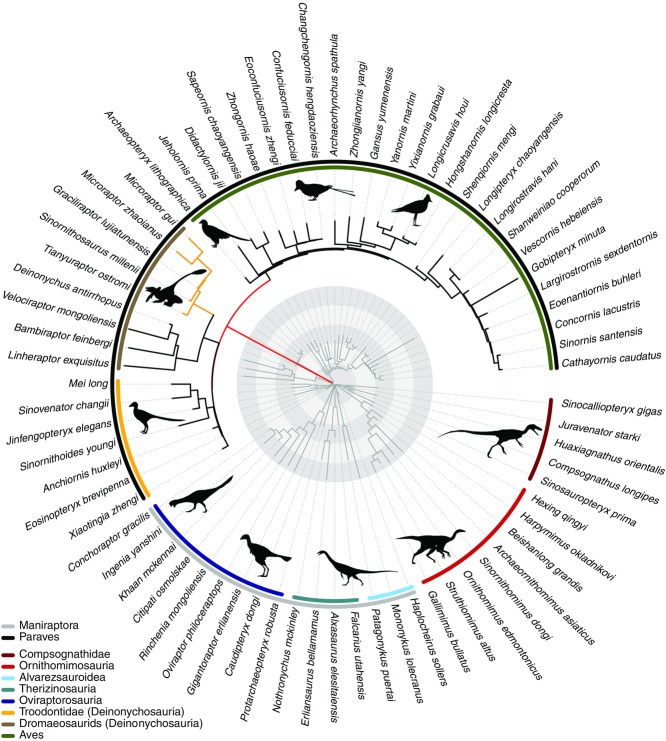
Figure 1.
Rates of femur and forelimb evolution in Theropoda. Branch lengths are scaled, (i) red branch leading to the Paraves indicating an ∼200-fold rate increase relative to the background rate and (ii) yellow branches to Microraptorinae indicating an approximately eightfold rate increase relative to the background rate (not scaled relative to evolutionary rate). The original time-calibrated phylogeny is shown in dark gray. Circular rings indicate 5 Ma time intervals from the KPg boundary. Silhouettes drawn by Scott Hartman, Matt Martyniuk, Emily Willoughby, Jaime Headon, and Craig Dylke or modified by T. Michael Keesey were downloaded from http://phylopic.org.

