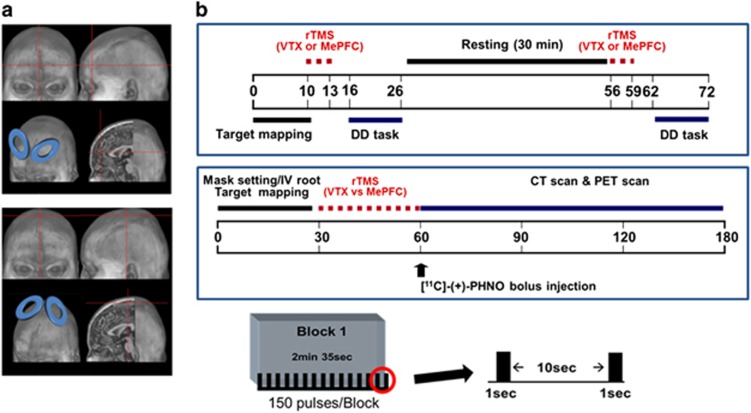
Figure 1.
Stimulation target areas and protocol. (a) The MePFC (upper figure) and vertex (lower figure) target area mapped on Colin brain (b) experimental procedures for behavioral (upper figure) and PET imaging (lower figure) studies. For each rTMS session, 15 10-pulse trains of 1-s duration were delivered at a stimulation frequency of 10 Hz, with a between-train interval of 10 s.

