Figure 1.
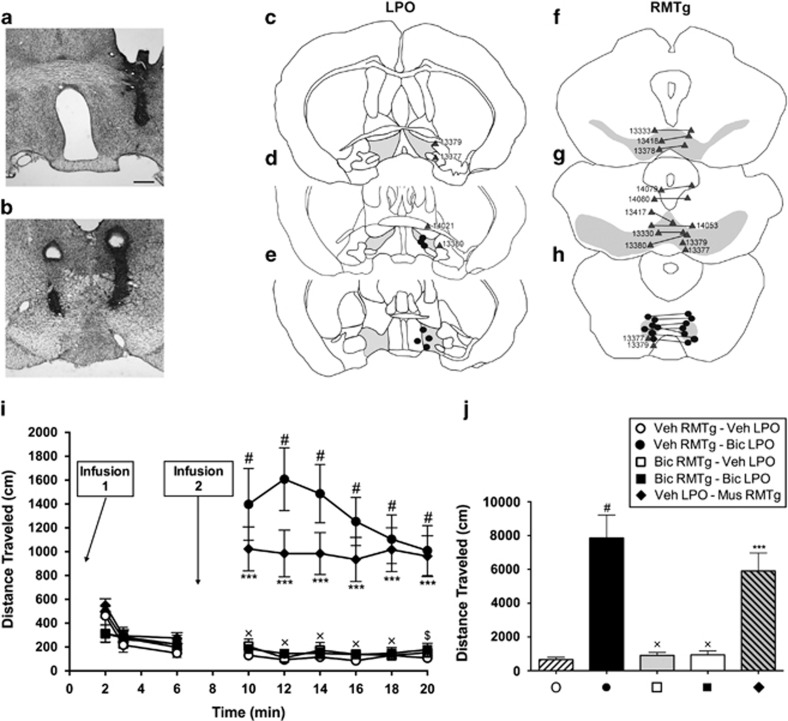
(a and b) Nissl-stained sections of the brain showing representative cannula placements for LPO (a) and RMTg (b). (c–h) Diagrams of series of sections ordered from rostral (top) to caudal (bottom) showing infusion sites. The gray shading in the sections illustrates the approximate boundaries of the LPO (c–e), VTA (f and g) and RMTg (h). Black dots indicate on-target infusion sites; gray triangles indicate off-target sites and are identified by corresponding case numbers. (i) Distance traveled following infusions of vehicle, muscimol, and bicuculline into the LPO and RMTg. For all conditions, n=7. Infusion 1 indicates the initial infusions, which are provided in the legend above panel (j). Second infusions (Infusion 2 in panel (i)) were given 6 min later. Distance traveled was recorded in 2-min bins for a total of 20 min and analyzed with a two-way ANOVA (distance × time) with Tukey's multiple comparison's test post hoc. (j) Graph showing total distances traveled during 10–20 min for each condition shown in panels (i and j), which were tested with a one-way ANOVA and post hoc Tukey's multiple comparisons test. In panel (i): #p<0.0001 and ***p<0.001 relative to vehicle control, $p<0.001 and xp<0.0001 for bicuculline in LPO (closed circles, min 10–20) vs bicuculline in RMTg and LPO (closed squares, 10–20 min). In panel (j): #p<0.0001 and ***p<0.001 relative to vehicle; xp<0.0001 relative to bicuculline in LPO (closed circle). Scale bar—400 μm.

