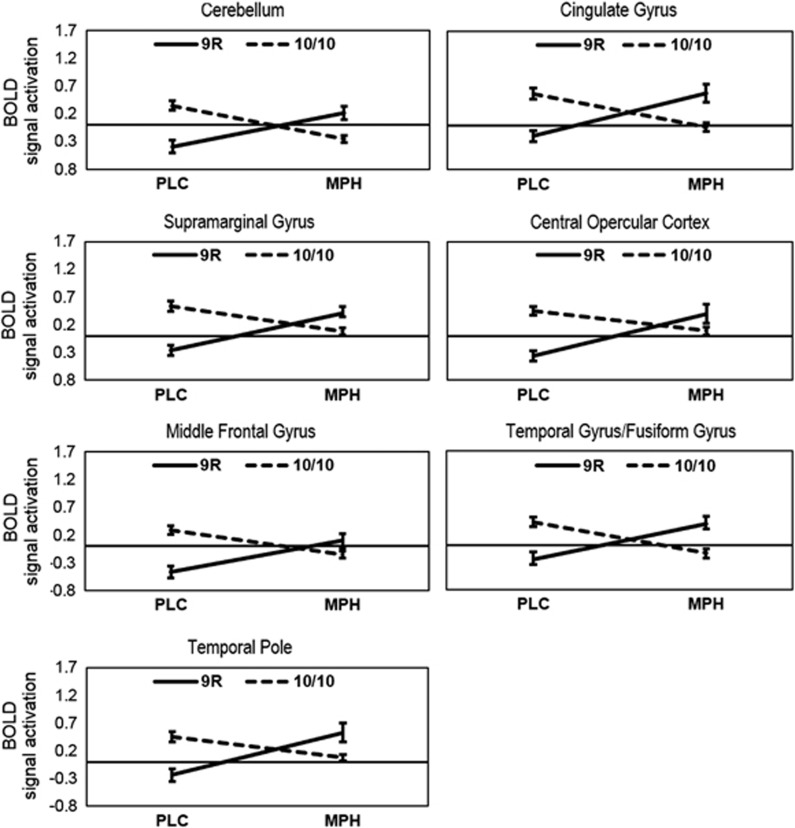
Figure 2.
The interaction between Genotype (9R, 10/10) and Drug (placebo (PLC), methylphenidate (MPH)) in each of the clusters in the contrast correct no-go>correct odd (see Table 2). The y axis describes mean BOLD signal activation in the corresponding cluster. Error bars represent the SEM.

