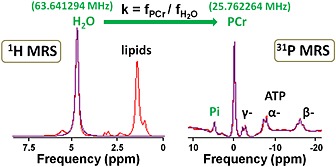
Figure 1.

Example of 1H and 31P MR spectra acquired at 1.5 T in a healthy volunteer muscle used to calibrate the water‐based method. H2O, water; PCr, phosphocreatine; Pi, inorganic phosphate; α, β, γ, nucleoside triphosphates. Peaks of interest of each spectrum are labelled in green. For this particular example, the measured frequencies were = 63.641294 MHz and f PCr = 25.762264 MHz, giving k = 0.40480421. The frequency of water signal from the 1H spectrum was multiplied by the experimentally derived constant k to create a virtual peak in the 31P spectrum, called the estimated PCr. Subsequently, pH was calculated using the Henderson–Hasselbalch equation and the chemical shift difference between the measured Pi and the estimated PCr.
