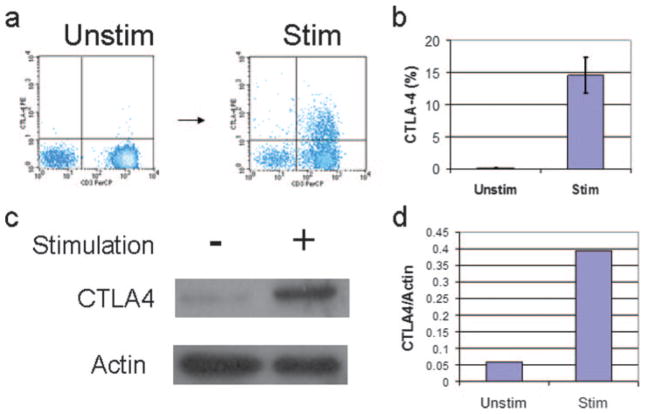
FIGURE 1.
CTLA-4 is rapidly induced in primary human T lymphocytes. a, Surface level CTLA-4 expression as determined in representative normal PBMCs by flow cytometry. PBMCs were stimulated with PMA/A23187 and stained with Abs to CD3 and CTLA-4. The level of CTLA-4 expression is undetectable in unstimulated lymphocytes, but increases in stimulated CD3 lymphocytes in PBMCs from normal volunteers. b, The average level of expression of surface CTLA-4 in T lymphocytes at 18 h after stimulation. Results represent analysis from 12 individuals, with mean level = 15%, SD ± 0.1%. c, Total CTLA-4 protein expression from PBMCs as measured by immunoblots. Actin immunoblot was performed to normalize for protein level. PBMCs were stimulated and lysed at 6 h. Equal protein was separated by SDS-PAGE and immunoblots were performed as described in Materials and Methods. Representative findings are from three independent experiments. d, Densitometric measurement of CTLA-4 immunoblot shown in c as determined using NIH ImageJ software. Levels of CTLA-4 are relative to the expression of the actin level that has been normalized by the OD among the samples.

