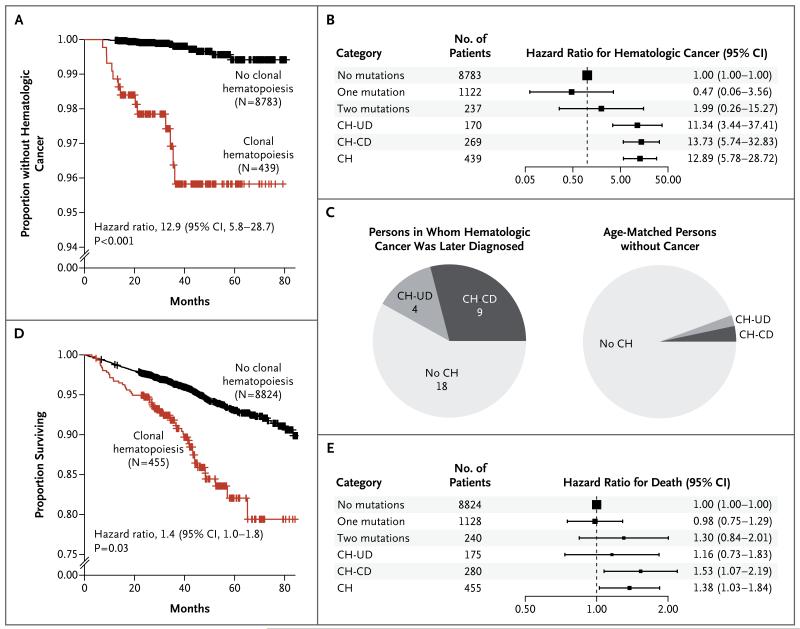
Figure 3. Risk of Hematologic Cancer for Participants with Clonal Hematopoiesis.
Panels A and D show Kaplan–Meier plots of the proportions of participants who did not receive a diagnosis of hematologic cancer (Panel A) and for surviving participants (Panel D). Panels B and E show hazard ratios for hematologic cancer (Panel B) and death (Panel E) for participants with exactly one putative somatic mutation and no candidate drivers (one mutation), those with exactly two putative somatic mutations and no candidate drivers (two mutations), those with clonal hematopoiesis and unknown drivers (CH-UD), those with clonal hematopoiesis and candidate drivers (CH-CD), and those having clonal hematopoiesis with candidate or unknown drivers (CH), all compared with participants with no candidate drivers and no putative somatic mutations (no mutations). Panel C shows the proportions of participants who had clonal hematopoiesis with candidate or unknown drivers among 31 participants in whom hematologic cancers were diagnosed at least 6 months after DNA sampling, as compared with the proportions in a group of age-matched persons without hematologic cancer over a similar follow-up period.

