Figure 3.

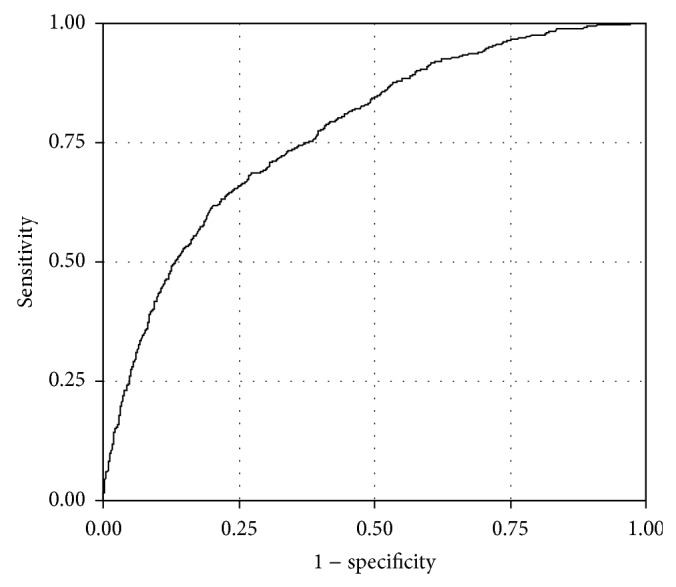
Receiver operator characteristic (ROC) curve for accuracy of final regression model for grades 2 and 3 steatosis versus grade 1 steatosis. The area under the curve was 0.7724.

Receiver operator characteristic (ROC) curve for accuracy of final regression model for grades 2 and 3 steatosis versus grade 1 steatosis. The area under the curve was 0.7724.