Figure 6.

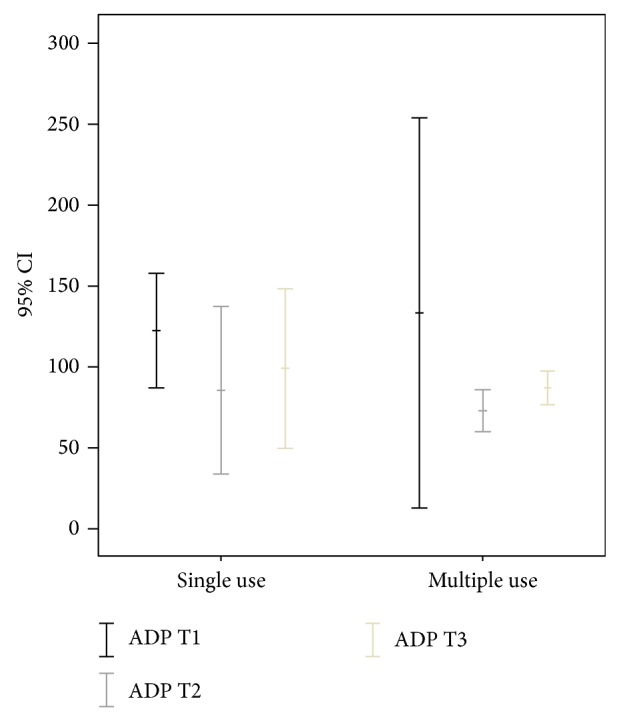
Results of platelet function analysis using adenosine phosphate (ADP) prior to administration (T1), half an hour after administration (T2), and three hours after administration (T3); y-axis in seconds.

Results of platelet function analysis using adenosine phosphate (ADP) prior to administration (T1), half an hour after administration (T2), and three hours after administration (T3); y-axis in seconds.