Table 1.
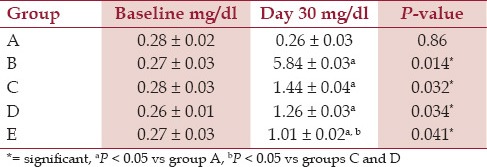
Th e 24-hour urinary oxalate concentration in all groups at the baseline and day 30 of experiment (Mean ± standard deviation, SD)

Th e 24-hour urinary oxalate concentration in all groups at the baseline and day 30 of experiment (Mean ± standard deviation, SD)
