Figure 2.

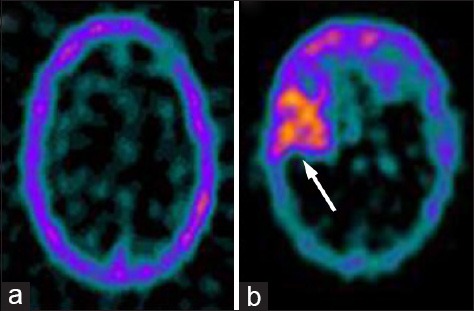
Representative images of a normal tumor negative transaxial 99m-technetium (99mTc)-glucoheptonate (GHA) brain single photon emission computed tomography (SPECT) (a) and a tumor positive 99mTc-GHA brain SPECT (b, arrow)

Representative images of a normal tumor negative transaxial 99m-technetium (99mTc)-glucoheptonate (GHA) brain single photon emission computed tomography (SPECT) (a) and a tumor positive 99mTc-GHA brain SPECT (b, arrow)