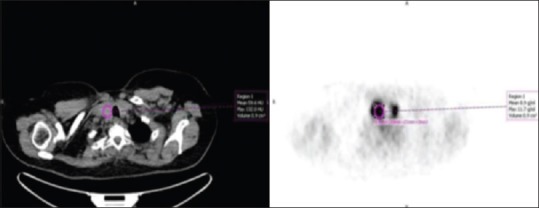
Figure 2.

Thyroid uptake was always then confirmed on axial computed tomography images (left). A circular region of interest with a fixed diameter was placed over the region of highest intensity in each lobe of the thyroid gland to calculate maximal standardized uptake value (right)
