
Figure 2.
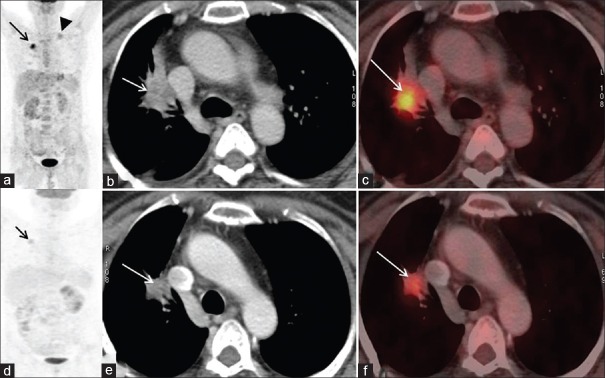
Discordance on metabolic and morphological imaging. There is no significant interval change in size on axial CT images (2b and e – arrow). However, coronal maximum intensity projection (MIP) (2a and d – arrow) and axial fused PET/CT (2c and f– arrow) images show significant regression in metabolic activity Coronal MIP (2a – arrowhead) also demonstrates tracer uptake in left supraclavicular node (arrowhead), which completely regresses on post-treatment MIP image. Thus stable disease (SD) on RECIST is discordant with EORTC criteria, which show partial metabolic response (PMR)