
Figure 2.
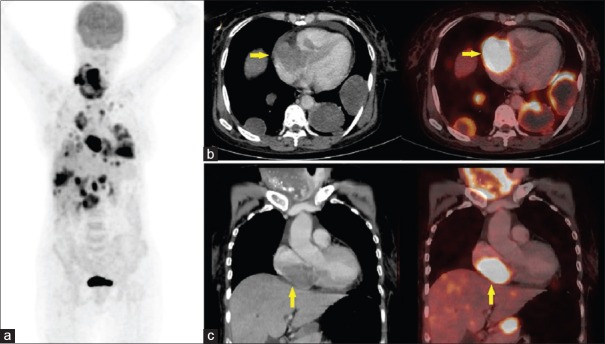
18F-fluoro-deoxyglucose (FDG) contrast enhanced positron emission tomography-computed tomography (PET-CT) images. (a) Whole body maximum intensity projection images showing intense FDG uptake in cardiac mass with multiple FDG avid metastases, (b) transaxial CT and corresponding fused PET-CT, (c) coronal CT and corresponding fused PET-CT sectional images showing very high FDG uptake in a hypodense mass in right atrium (SUVmax 19.2) with associated pericardial infiltration and minimal pericardial effusion