
Figure 1.
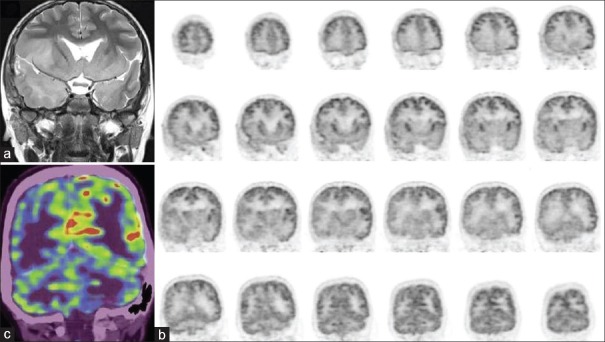
(a) Magnetic resonance imaging of the brain showing hyperintensity in bilateral temporal lobes and insular cortex. Coronal positron emission tomography (PET) images (b) and fused coronal PET/computed tomography (c) Hypometabolism of bilateral temporal lobes (right > left)