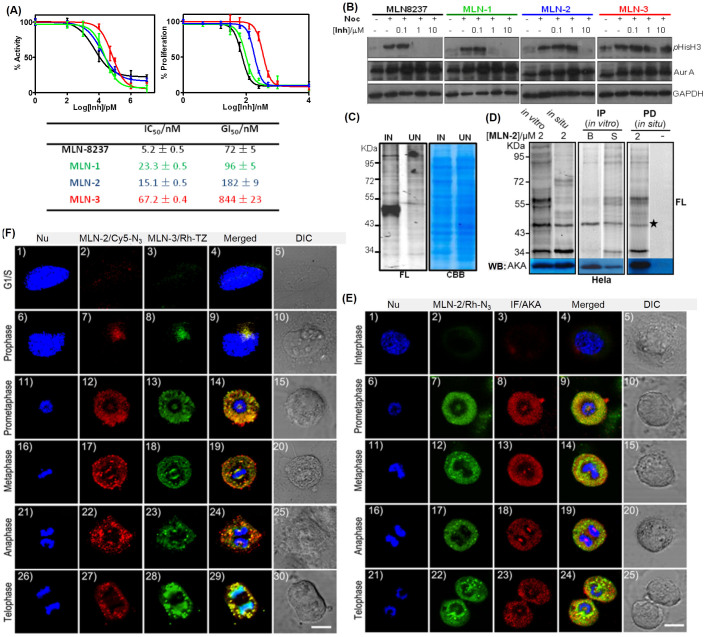
Figure 2. Target profiling and imaging of MLN8236 probes.
(A) IC50 (left) and GI50 (right) plots and the corresponding values (bottom table) of MLN8237, MLN-1, MLN-2 and MLN-3 against recombinant AKA in a Kinase-Glo™ inhibition assay, and XTT anti-proliferation assay in HeLa cells. (B) Western blotting (WB) analysis showing dose-dependent inhibition of phosphorylation of histone H3 (Ser 10) in synchronized HeLa cells with MLN8237/MLN-1/2/3. Nocodazole “-”: asynchronized cells. WB of anti-AKA and anti-GADPH antibodies were used to show equal expression of AKA and equal loading in each lane. (C) Labeling of lysates from AKA-overexpressed bacterial cells (IN: IPTG-induced; UN: uninduced) using 2 μM of MLN-2. (left: in-gel fluorescence; right: coomassie). (D) In vitro and in situ labeling of synchronized HeLa cells/cell lysates with 2 μM of MLN-2 (left), and further enriched by immunoprecipitation (IP: middle) or pull-down (PD; right). They were visualized by in-gel fluorescence scanning (FL) and Western blotting (WB) with anti-AKA antibody. Different reporters were used (left and middle: Rh-N3; right: Rh-Biotin-N3 The fluorescent band corresponding to the MLN-2-labeled endogenous AKA was detected at ~46 KD (marked with *). In the IP gels (middle), B: bead-bound fraction; S: supernatant. For negative PD, both DMSO (shown; labeled “-”) and NP were used in place of MLN-2. (E) Co-localization imaging experiments of MLN-2/Rh-N3 (green) and anti-AKA antibodies (red) at different stages of asynchronized mitotic HeLa cells. (F) Co-localization multiplex imaging experiments of MLN-2/Cy5-N3 (red) and MLN-3/Rh-TZ (green) at different stages of asynchronized mitotic HeLa cells. Scale bar = 10 μm for (E)/(F). Full-length blots are presented in Supplementary Figures.

