
Figure 1.
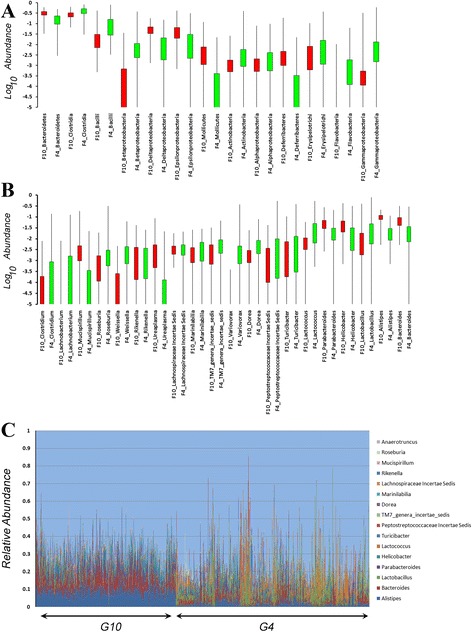
Comparison of microbiota composition between G 4 and G 10 populations. (A, B) Box and whisker plots for the Log10 relative abundances of taxa ((A) Class, (B) Genus) that are shared between the G4 (green) and G10 (red) populations. The boxes represent 75% of the data and whiskers indicate the range. (C) The relative abundances of the 16 shared genera between the G4 and G10 populations. G10 mice are shown on the left by cohort and G4 mice are on the right ordered by cohort.