
Figure 4.
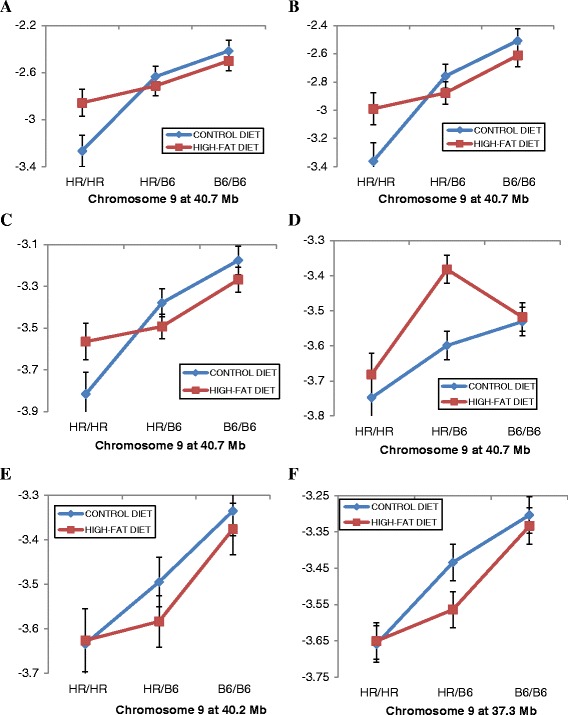
QTL on Chr 9 show complex interactions with diet. (A-F) Plots of genotypic values at the QTL peak (X axis) are shown for six different OTUs that have peaks at the same or similar location on Chr 9 and which show differential effects depending on whether the G10 mice were fed the control or the high-fat diet. Relative abundances of the OTUs for animals having the HR/HR parental, HR/B6 heterozygote, or B6/B6 parental genotypes at QTL peak are plotted on the Y-axis. (A) OTU17740. (B) OTU25269. (C) OTU25483. (D) OTU13989. (E) OTU29084. (F) OTU41353. Error bars based on standard error.