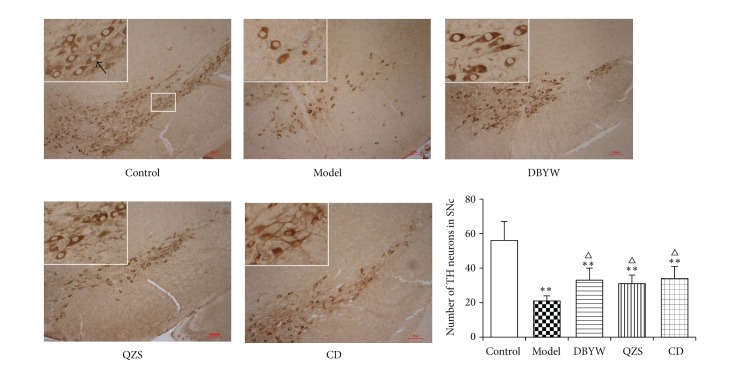
Figure 2.
Immunohistochemistry analysis revealed differential number of TH immunopositive neurons in the SN of various treatment groups. Area within rectangle is shown in higher magnification at the top left corner of each picture. The black arrow points to typical TH-positive neurons. Scale bar: 100 μm. Data are expressed as mean ± SEM (N = 6, ** P < 0.01 versus control group, △ P < 0.05 versus model group). DBYW: Da-Bu-Yin-Wan; QZS: Qian-Zheng-San; CD: combined decoction.

