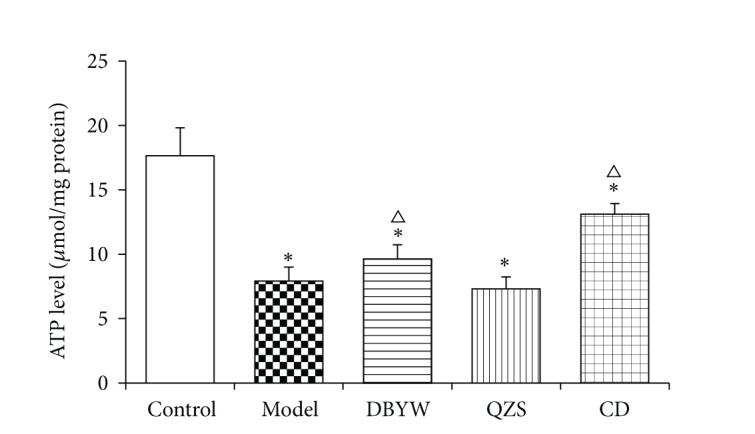
Figure 3.

The ATP levels in mice midbrain. The mean ± SEM (N = 6, * P < 0.05 versus control group, △ P < 0.05 versus model group), expressed as relative luminescence units (RLU)/mg protein (μ mol/mg protein). DBYW: Da-Bu-Yin-Wan; QZS: Qian-Zheng-San; CD: combined decoction.
