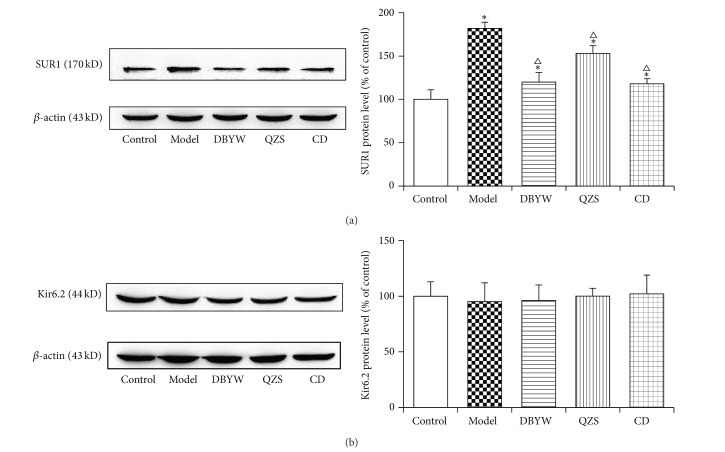
Figure 5.
Effects of decoctions on protein levels of SUR1 (a) and Kir6.2 (b) measured by Western blot. Density values for each band were first normalized to loading control (β-actin) and then to the control group. Data are expressed as mean ± SEM (N = 5, * P < 0.05 versus control group, △ P < 0.05 versus model group). DBYW: Da-Bu-Yin-Wan; QZS: Qian-Zheng-San; CD: combined decoction.

