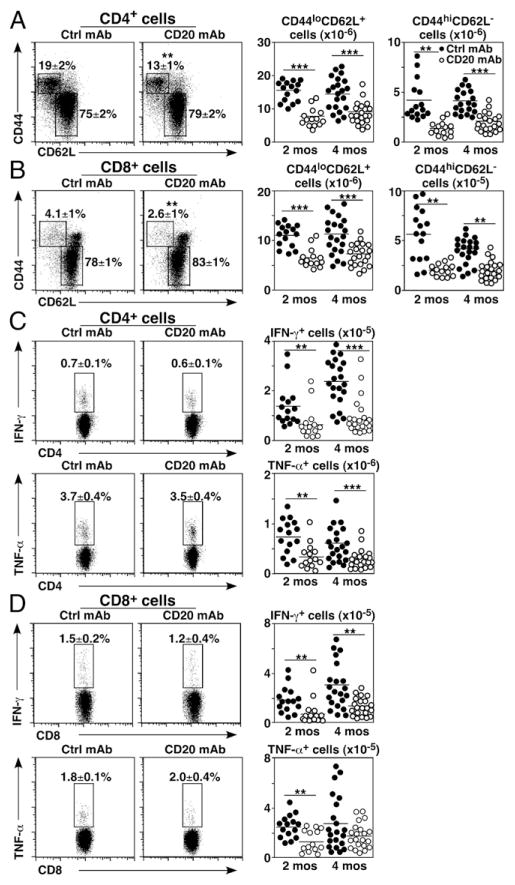
FIGURE 2.
B cell depletion alters naive and memory T cell homeostasis. Naive 2- or 4-mo-old mice were treated with control (closed circles) or CD20 mAb (open circles). Viable, single spleen lymphocytes were isolated 14 d later (A–D) and depleted of B cells using CD19 mAb-coated magnetic beads (C and D). The remaining non–B cells were cultured for 3.5 h with plate-bound CD3/CD28 mAbs before cell-surface CD4/CD8 labeling and intracellular cytokine staining with flow cytometry analysis. Representative panels show CD44 versus CD62L staining (left panels) and cell numbers (right panels) for CD4+ (A) and CD8+ (B) T cells. Representative panels show IFN-γ and TNF-α expression (left panels) and cell numbers (right panels) for CD4+ (C) and CD8+ (D) T cells. (A–D) Mean cell frequencies (± SEM) within the indicated dot plot gates are shown. Graphs show results from individual mice (n = 15–21 mice/group in three to four independent experiments) with means indicated by horizontal bars. Significant differences between sample means are indicated: **p < 0.01, ***p < 0.001. Ctrl, control.

