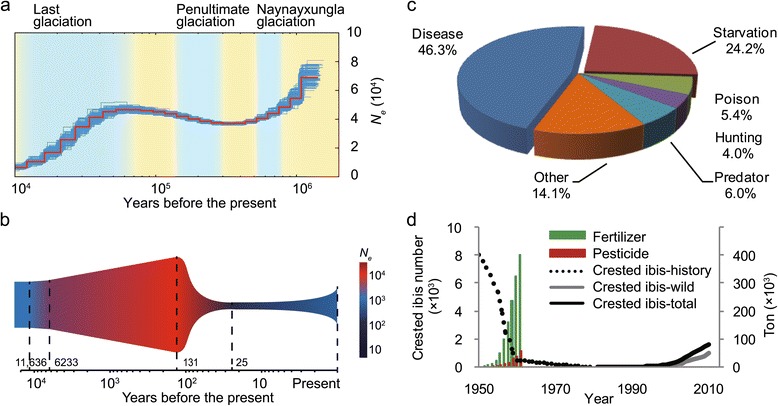
Figure 5.

Demographic history reconstruction of the Chinese crested ibis population based on the resequenced data from eight resequenced individuals. (a) Estimation based on the PSMC (pairwise sequentially Markov coalescent) model. The red line depicts the estimated effective population size (N e), and the thin blue curves represent PSMC bootstrapping estimates. The sky blue and yellow background colors indicate glacial and interglacial periods, respectively. (b) Estimation based on the ∂a∂i calculator. The timing of demographic events is indicated (vertical dashed lines; x-axis indicates time in logarithmic scale). (c) Percent of deaths from various causes of the wild crested ibis from 1981 to 2003 [14]. (d) Agrochemical usage and population size. The population size was negatively correlated with the usage of pesticides and fertilizers during 1950s to early 1960s in China (fertilizer, r = -0.92, P <0.001; pesticide, r = -0.95, P <0.001). Agrochemical use has been forbidden in the sanctuary designated for the recued ibis population since 1981. P values were calculated based on linear regression (data on pesticide and fertilizer usage are summarized in Additional file 1: Table S17).
