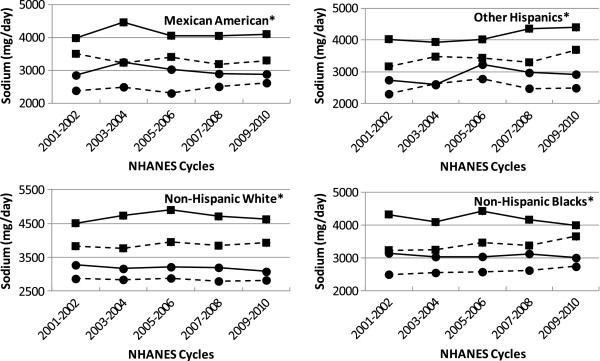
Figure 2.

Sodium intake trends by age and gender groups over 5 NHANES cycles in population subgroups. Data from NHANES 2001–2010. Square: male, Circles: females, solid line: 19–50 years, dotted line: 51 + years. Usual intakes from foods were estimated by using the National Cancer Institute method. *No change over 5 NHANES cycles, P > 0.01.
