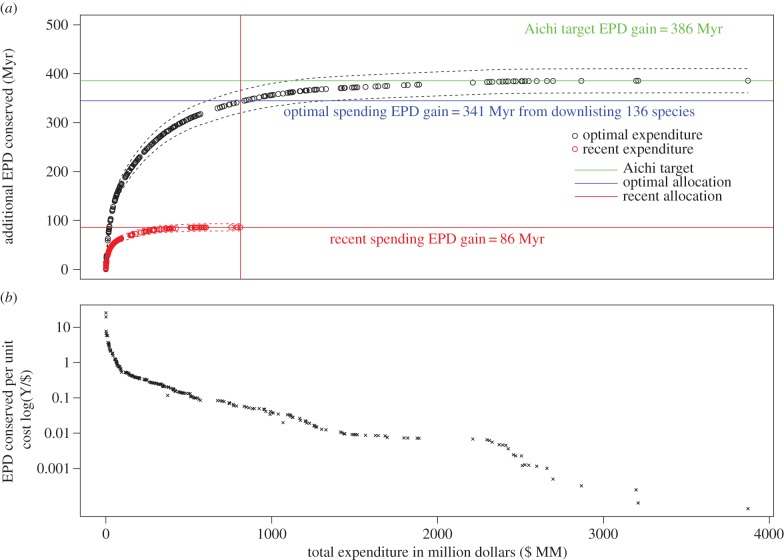
Figure 3.
(a) The PD gain achieved through optimal allocation of financial resources for maximizing future EPD within a cohort of 206 globally threatened birds. Dashed lines represent the standard deviation; circles represent downlisting events, following the ADEPD-cost ranking. The expected PD gain from current spending patterns is shown as a red line. The equivalent gain achieved by optimal spending of the same funds is shown in blue and is 3.8 times higher. The PD gain that would be achieved by downlisting all species and meeting the Aichi target is shown in green. (b) The rate of change of (a) to give a measure of PD gain per unit cost in relation to total expenditure, which varies from $0.059 to $3915 per year of PD saved.

