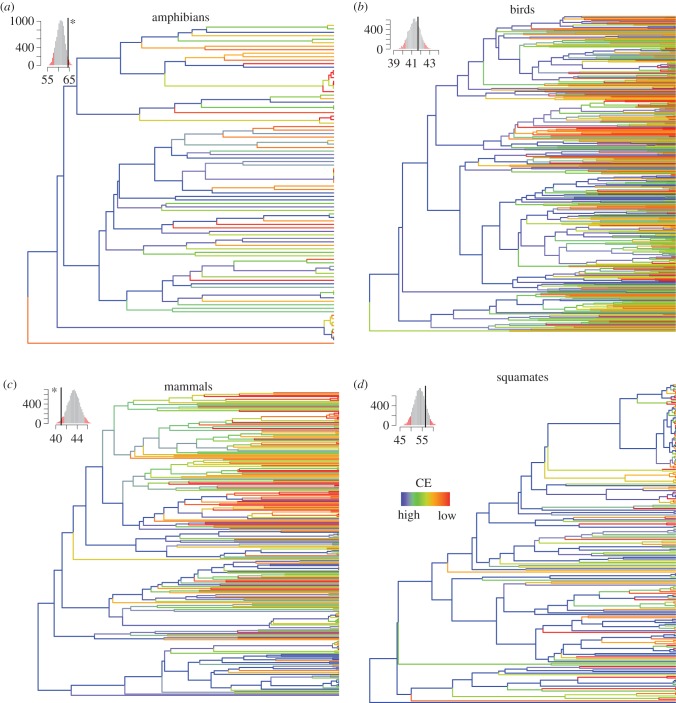
Figure 6.
Species' target achievements mapped onto the functional tree of each group. For the four groups, species' target achievements were mapped onto the tree. For each internal branch, the maximum target achievement for the descendant was taken. Colours from red to blue indicate lowest to highest CE. The subplot in the corner represents the CE under random species' target achievements along the tree (9999 repeats). Red indicates the level of significance at 0.05 and 95%. The black line indicates the observed CE. The black asterisk close to the black line indicates significance at 0.05 (one sided). The trees and null models have been carried out over one randomly taken tree from the 100 maximum-likelihood trees for each group.

